data(penguins, package = "palmerpenguins")4 Dataframes (or, a group of vectors)
Dataframes are a special object in R. A dataframe is simply a collection of vectors and looks like a typical excel spreadsheet. The columns of a dataframe are each vectors that contain variables and a row contains an observation. This is the coding equivalent of an excel spreadsheet. If you are using Positron, clicking the dataframe in the Variables tab or typing View(df_name) into the console will let you interactively scroll though the data.
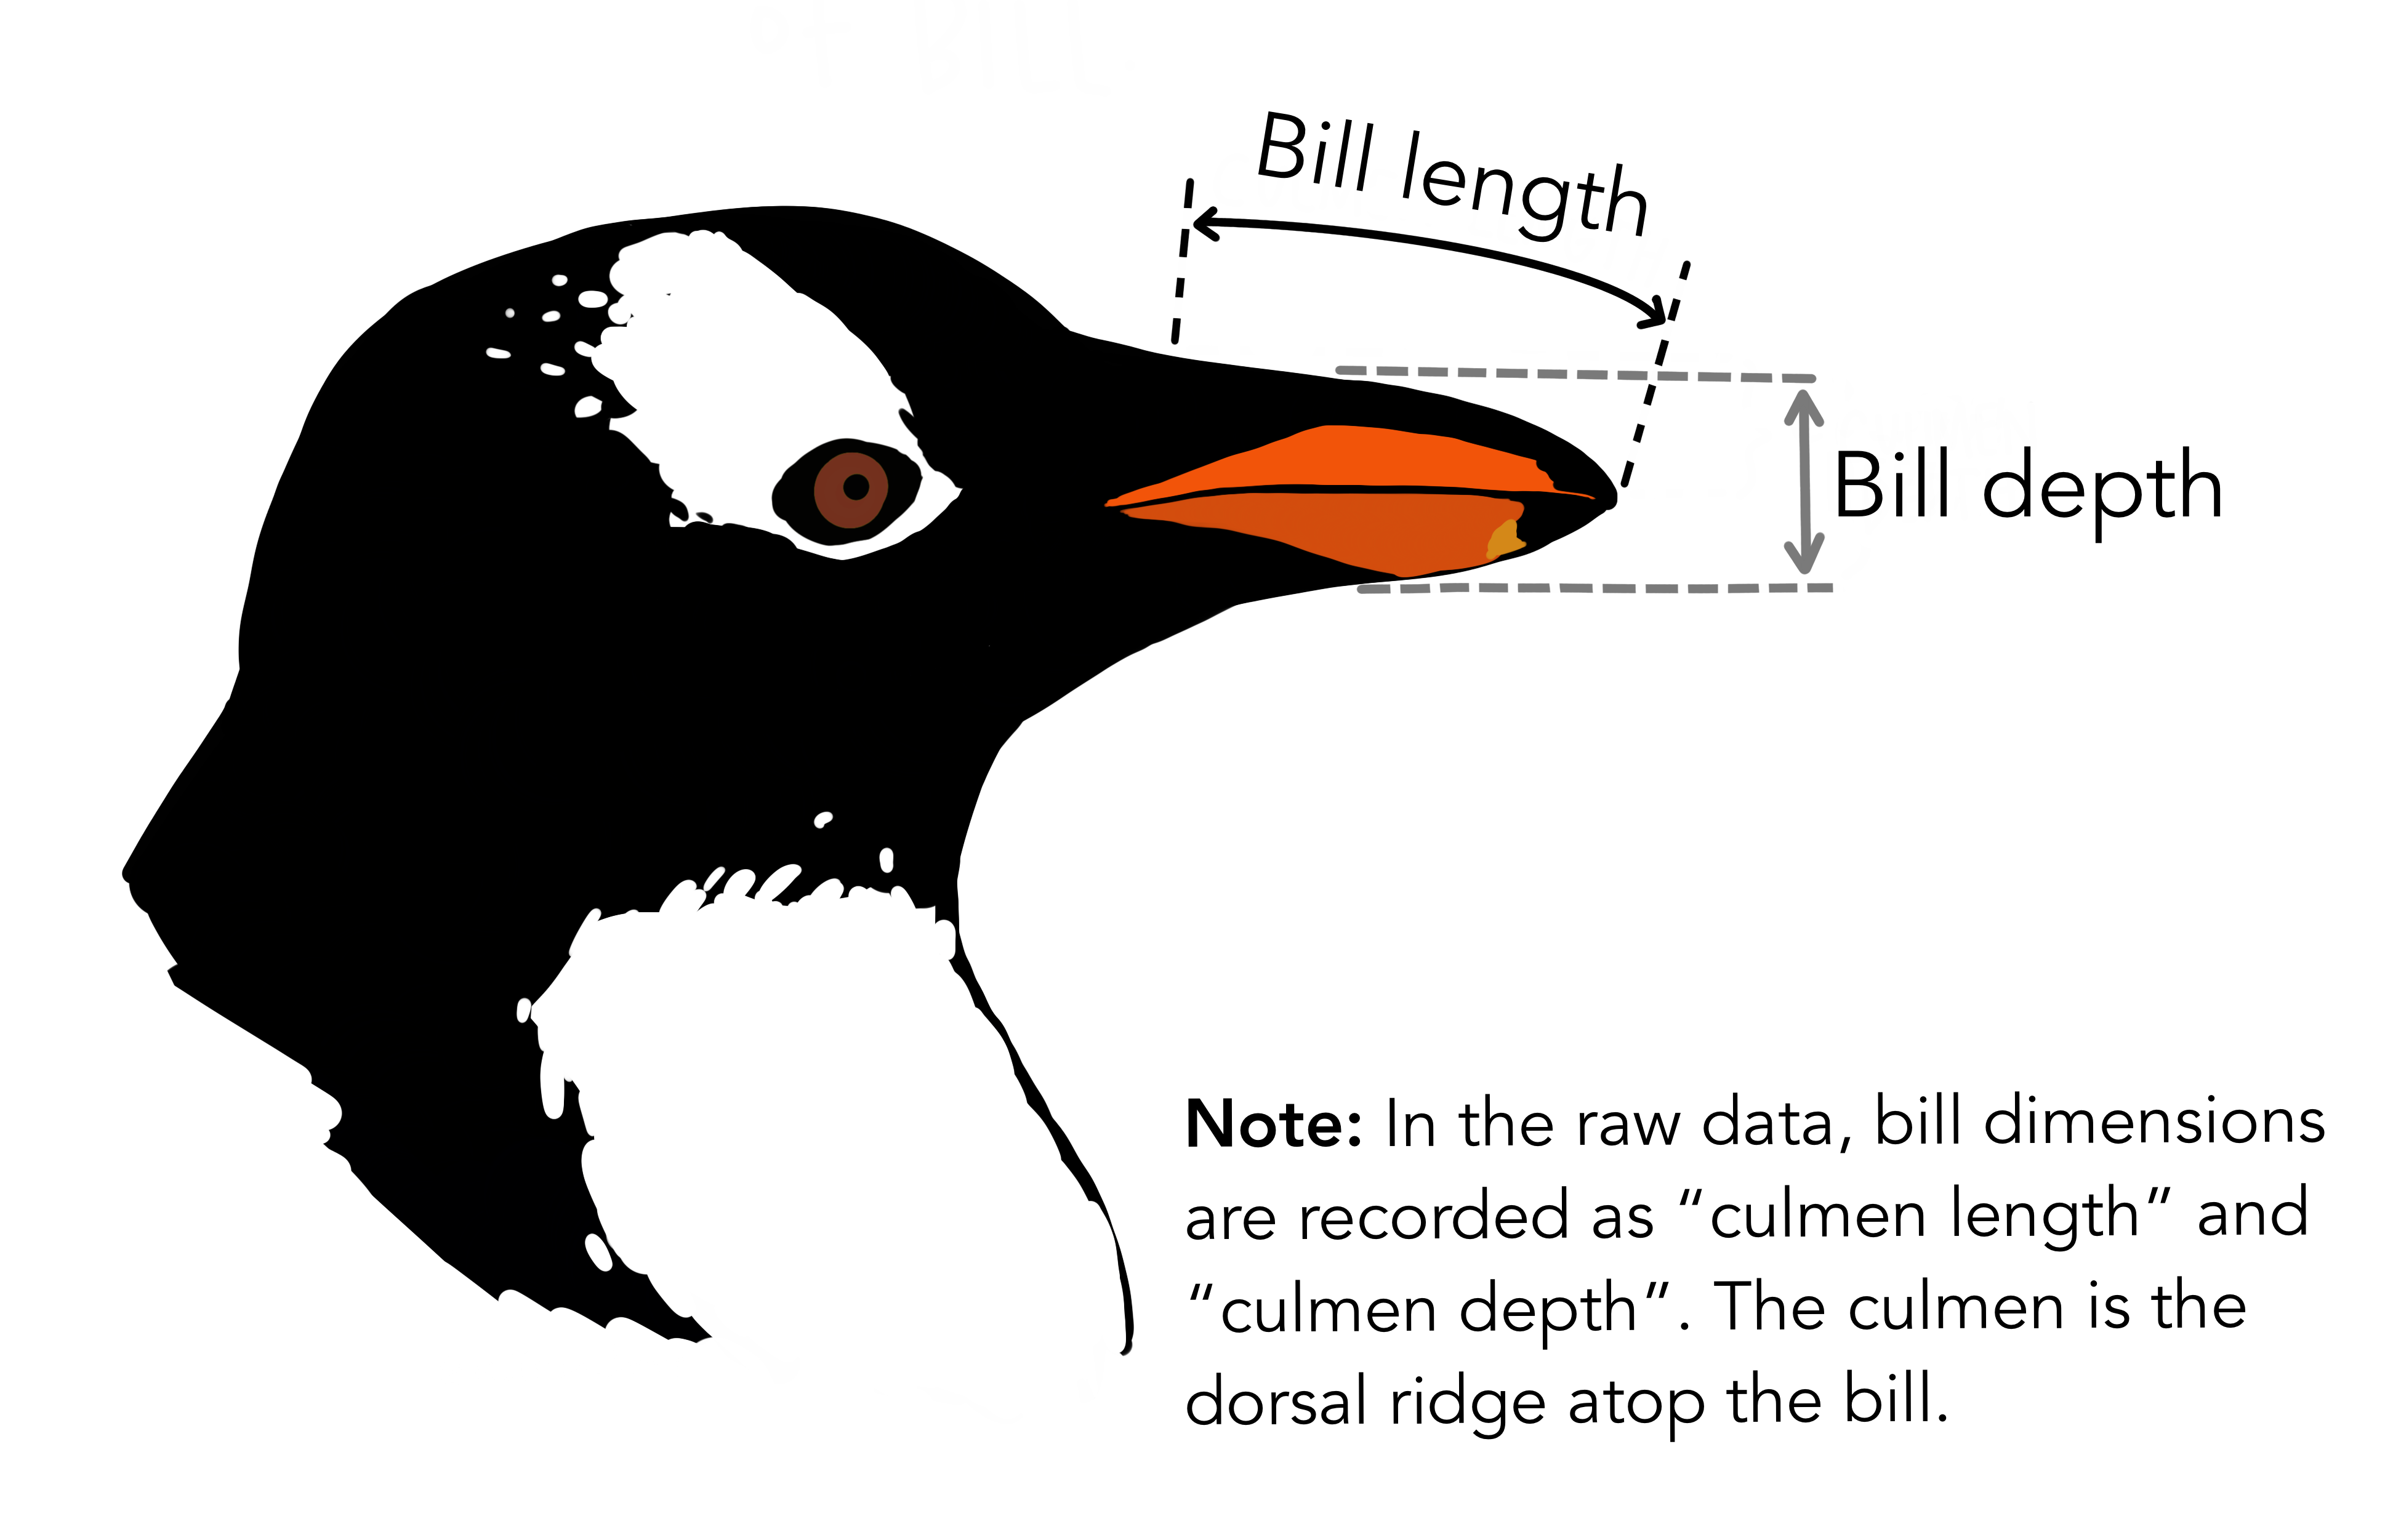
First, we will load some data.frames that come with a package in R. We can do that using the data function. Let’s load the penguins data set which contain a census conducted on multiple species of penguins on a set of islands: 
We can use the head() function to view the first few rows. It prints out the first 6 rows of the dataset so you can see the variables. BTW, this function works on vectors too!
head(penguins)# A tibble: 6 × 8
species island bill_length_mm bill_depth_mm flipper_length_mm body_mass_g
<fct> <fct> <dbl> <dbl> <int> <int>
1 Adelie Torgersen 39.1 18.7 181 3750
2 Adelie Torgersen 39.5 17.4 186 3800
3 Adelie Torgersen 40.3 18 195 3250
4 Adelie Torgersen NA NA NA NA
5 Adelie Torgersen 36.7 19.3 193 3450
6 Adelie Torgersen 39.3 20.6 190 3650
# ℹ 2 more variables: sex <fct>, year <int>Another helpful function is str() which prints a similar format, but is a little easier to read, especially when there are a lot of variables in the dataset.
str(penguins)tibble [344 × 8] (S3: tbl_df/tbl/data.frame)
$ species : Factor w/ 3 levels "Adelie","Chinstrap",..: 1 1 1 1 1 1 1 1 1 1 ...
$ island : Factor w/ 3 levels "Biscoe","Dream",..: 3 3 3 3 3 3 3 3 3 3 ...
$ bill_length_mm : num [1:344] 39.1 39.5 40.3 NA 36.7 39.3 38.9 39.2 34.1 42 ...
$ bill_depth_mm : num [1:344] 18.7 17.4 18 NA 19.3 20.6 17.8 19.6 18.1 20.2 ...
$ flipper_length_mm: int [1:344] 181 186 195 NA 193 190 181 195 193 190 ...
$ body_mass_g : int [1:344] 3750 3800 3250 NA 3450 3650 3625 4675 3475 4250 ...
$ sex : Factor w/ 2 levels "female","male": 2 1 1 NA 1 2 1 2 NA NA ...
$ year : int [1:344] 2007 2007 2007 2007 2007 2007 2007 2007 2007 2007 ...The output of string shows that a data.frame is just a list of vectors that have names (species, island, …).
Finally, you can access the number of rows and number of columns with nrow/ncol
print(paste0(nrow(penguins), " obs. of ", ncol(penguins), " variables"))[1] "344 obs. of 8 variables"4.0.0.1 Exercise
- What constitutes a row in the penguins dataframe? What constitutes a column?
4.1 Accessing vectors by name with $
The first thing we might want to do is access some of the vectors from the penguins dataframe. If you type species into the console and hit enter, you will see this error: Error: object 'species' not found. Get used to recognizing this error becuase you will probably accidentally make this mistake a lot at first.
This errors occurs because R does not know that you mean “look for species in the penguins dataset”. To access an individual vector, we must specify both the dataframe and the vector’s name. To do this, we use the $ operator like this: penguins$species. This looks into the dataframe stored in the penguins variable and looks for the vector named species:
penguins$species [1] Adelie Adelie Adelie Adelie Adelie Adelie Adelie
[8] Adelie Adelie Adelie Adelie Adelie Adelie Adelie
[15] Adelie Adelie Adelie Adelie Adelie Adelie Adelie
[22] Adelie Adelie Adelie Adelie Adelie Adelie Adelie
[29] Adelie Adelie Adelie Adelie Adelie Adelie Adelie
[36] Adelie Adelie Adelie Adelie Adelie Adelie Adelie
[43] Adelie Adelie Adelie Adelie Adelie Adelie Adelie
[50] Adelie Adelie Adelie Adelie Adelie Adelie Adelie
[57] Adelie Adelie Adelie Adelie Adelie Adelie Adelie
[64] Adelie Adelie Adelie Adelie Adelie Adelie Adelie
[71] Adelie Adelie Adelie Adelie Adelie Adelie Adelie
[78] Adelie Adelie Adelie Adelie Adelie Adelie Adelie
[85] Adelie Adelie Adelie Adelie Adelie Adelie Adelie
[92] Adelie Adelie Adelie Adelie Adelie Adelie Adelie
[99] Adelie Adelie Adelie Adelie Adelie Adelie Adelie
[106] Adelie Adelie Adelie Adelie Adelie Adelie Adelie
[113] Adelie Adelie Adelie Adelie Adelie Adelie Adelie
[120] Adelie Adelie Adelie Adelie Adelie Adelie Adelie
[127] Adelie Adelie Adelie Adelie Adelie Adelie Adelie
[134] Adelie Adelie Adelie Adelie Adelie Adelie Adelie
[141] Adelie Adelie Adelie Adelie Adelie Adelie Adelie
[148] Adelie Adelie Adelie Adelie Adelie Gentoo Gentoo
[155] Gentoo Gentoo Gentoo Gentoo Gentoo Gentoo Gentoo
[162] Gentoo Gentoo Gentoo Gentoo Gentoo Gentoo Gentoo
[169] Gentoo Gentoo Gentoo Gentoo Gentoo Gentoo Gentoo
[176] Gentoo Gentoo Gentoo Gentoo Gentoo Gentoo Gentoo
[183] Gentoo Gentoo Gentoo Gentoo Gentoo Gentoo Gentoo
[190] Gentoo Gentoo Gentoo Gentoo Gentoo Gentoo Gentoo
[197] Gentoo Gentoo Gentoo Gentoo Gentoo Gentoo Gentoo
[204] Gentoo Gentoo Gentoo Gentoo Gentoo Gentoo Gentoo
[211] Gentoo Gentoo Gentoo Gentoo Gentoo Gentoo Gentoo
[218] Gentoo Gentoo Gentoo Gentoo Gentoo Gentoo Gentoo
[225] Gentoo Gentoo Gentoo Gentoo Gentoo Gentoo Gentoo
[232] Gentoo Gentoo Gentoo Gentoo Gentoo Gentoo Gentoo
[239] Gentoo Gentoo Gentoo Gentoo Gentoo Gentoo Gentoo
[246] Gentoo Gentoo Gentoo Gentoo Gentoo Gentoo Gentoo
[253] Gentoo Gentoo Gentoo Gentoo Gentoo Gentoo Gentoo
[260] Gentoo Gentoo Gentoo Gentoo Gentoo Gentoo Gentoo
[267] Gentoo Gentoo Gentoo Gentoo Gentoo Gentoo Gentoo
[274] Gentoo Gentoo Gentoo Chinstrap Chinstrap Chinstrap Chinstrap
[281] Chinstrap Chinstrap Chinstrap Chinstrap Chinstrap Chinstrap Chinstrap
[288] Chinstrap Chinstrap Chinstrap Chinstrap Chinstrap Chinstrap Chinstrap
[295] Chinstrap Chinstrap Chinstrap Chinstrap Chinstrap Chinstrap Chinstrap
[302] Chinstrap Chinstrap Chinstrap Chinstrap Chinstrap Chinstrap Chinstrap
[309] Chinstrap Chinstrap Chinstrap Chinstrap Chinstrap Chinstrap Chinstrap
[316] Chinstrap Chinstrap Chinstrap Chinstrap Chinstrap Chinstrap Chinstrap
[323] Chinstrap Chinstrap Chinstrap Chinstrap Chinstrap Chinstrap Chinstrap
[330] Chinstrap Chinstrap Chinstrap Chinstrap Chinstrap Chinstrap Chinstrap
[337] Chinstrap Chinstrap Chinstrap Chinstrap Chinstrap Chinstrap Chinstrap
[344] Chinstrap
Levels: Adelie Chinstrap GentooWhen using Positron, after you type the $ a little pop-up menu wil show up that shows you all the available variable names. You can use the arrow keys to find the variable and hit enter (or tab) to have it type the variable name for you.
Try that below to find the avariable measuring the depth of a penguin’s bill:
4.2 General subsetting with [,]
Now, let’s think about subsetting the dataframe to a specific set of rows. Given that we used [idx] for vectors (either a logical vector or integer index), you might think we can do the same with data.frames. This is good intuition, but remember a data frame has both rows and columns! We will still use [,] to subset, but we need a , to specify rows and columns.
The syntax therefore is df[ROWS, COLUMNS]. Before comma = rows and After comma = columns. If either ROWS or COLUMNS is left blank, then it will assume you want all rows or all colums respectively.
Let me show you some examples:
## First 5 rows, all columns
penguins[1:5,]
# A tibble: 5 × 8
species island bill_length_mm bill_depth_mm flipper_length_mm body_mass_g
<fct> <fct> <dbl> <dbl> <int> <int>
1 Adelie Torgersen 39.1 18.7 181 3750
2 Adelie Torgersen 39.5 17.4 186 3800
3 Adelie Torgersen 40.3 18 195 3250
4 Adelie Torgersen NA NA NA NA
5 Adelie Torgersen 36.7 19.3 193 3450
# ℹ 2 more variables: sex <fct>, year <int>## All rows, the species column
penguins[, "species"]# A tibble: 344 × 1
species
<fct>
1 Adelie
2 Adelie
3 Adelie
4 Adelie
5 Adelie
6 Adelie
7 Adelie
8 Adelie
9 Adelie
10 Adelie
# ℹ 334 more rows## First 5 rows, the species column
penguins[1:5, "species"]# A tibble: 5 × 1
species
<fct>
1 Adelie
2 Adelie
3 Adelie
4 Adelie
5 Adelie ## First 10 rows, the species and island columns
penguins[1:10, c("species", "island")]# A tibble: 10 × 2
species island
<fct> <fct>
1 Adelie Torgersen
2 Adelie Torgersen
3 Adelie Torgersen
4 Adelie Torgersen
5 Adelie Torgersen
6 Adelie Torgersen
7 Adelie Torgersen
8 Adelie Torgersen
9 Adelie Torgersen
10 Adelie TorgersenYou can “chain” together calls and between [,] and $ syntaxes. For example let’s say I want the variable island for the first 6 observations:
penguins[1:6, "island"]# A tibble: 6 × 1
island
<fct>
1 Torgersen
2 Torgersen
3 Torgersen
4 Torgersen
5 Torgersen
6 Torgersenpenguins[1:6, ]$island[1] Torgersen Torgersen Torgersen Torgersen Torgersen Torgersen
Levels: Biscoe Dream TorgersenBut, if I do penguins$island, this results in a vector. So, to get the first 6 elements, I use only [] without a comma:
penguins$island[1:6][1] Torgersen Torgersen Torgersen Torgersen Torgersen Torgersen
Levels: Biscoe Dream Torgersen4.2.0.1 Exercise
- Use the
unique()function to find the unique values of the variablespeciesin the penguins dataset.
- Use the
table()function to find how many penguins there are of each species.
- Imagine we use
penguins[1:5]to try and grab the first 5 rows. What happens?
4.3 Selecting rows based on criteria
Lets see which penguins live on Torgersen.
We can use the == operator to compare a vector to a value (or set of values). For example, here we see if each penguin’s island is "Torgersen". It produces a boolean vector of TRUEs and FALSEs
on_torgersen <- penguins$island == "Torgersen"
on_torgersen
[1] TRUE TRUE TRUE TRUE TRUE TRUE TRUE TRUE TRUE TRUE TRUE TRUE
[13] TRUE TRUE TRUE TRUE TRUE TRUE TRUE TRUE FALSE FALSE FALSE FALSE
[25] FALSE FALSE FALSE FALSE FALSE FALSE FALSE FALSE FALSE FALSE FALSE FALSE
[37] FALSE FALSE FALSE FALSE FALSE FALSE FALSE FALSE FALSE FALSE FALSE FALSE
[49] FALSE FALSE FALSE FALSE FALSE FALSE FALSE FALSE FALSE FALSE FALSE FALSE
[61] FALSE FALSE FALSE FALSE FALSE FALSE FALSE FALSE TRUE TRUE TRUE TRUE
[73] TRUE TRUE TRUE TRUE TRUE TRUE TRUE TRUE TRUE TRUE TRUE TRUE
[85] FALSE FALSE FALSE FALSE FALSE FALSE FALSE FALSE FALSE FALSE FALSE FALSE
[97] FALSE FALSE FALSE FALSE FALSE FALSE FALSE FALSE FALSE FALSE FALSE FALSE
[109] FALSE FALSE FALSE FALSE FALSE FALSE FALSE FALSE TRUE TRUE TRUE TRUE
[121] TRUE TRUE TRUE TRUE TRUE TRUE TRUE TRUE TRUE TRUE TRUE TRUE
[133] FALSE FALSE FALSE FALSE FALSE FALSE FALSE FALSE FALSE FALSE FALSE FALSE
[145] FALSE FALSE FALSE FALSE FALSE FALSE FALSE FALSE FALSE FALSE FALSE FALSE
[157] FALSE FALSE FALSE FALSE FALSE FALSE FALSE FALSE FALSE FALSE FALSE FALSE
[169] FALSE FALSE FALSE FALSE FALSE FALSE FALSE FALSE FALSE FALSE FALSE FALSE
[181] FALSE FALSE FALSE FALSE FALSE FALSE FALSE FALSE FALSE FALSE FALSE FALSE
[193] FALSE FALSE FALSE FALSE FALSE FALSE FALSE FALSE FALSE FALSE FALSE FALSE
[205] FALSE FALSE FALSE FALSE FALSE FALSE FALSE FALSE FALSE FALSE FALSE FALSE
[217] FALSE FALSE FALSE FALSE FALSE FALSE FALSE FALSE FALSE FALSE FALSE FALSE
[229] FALSE FALSE FALSE FALSE FALSE FALSE FALSE FALSE FALSE FALSE FALSE FALSE
[241] FALSE FALSE FALSE FALSE FALSE FALSE FALSE FALSE FALSE FALSE FALSE FALSE
[253] FALSE FALSE FALSE FALSE FALSE FALSE FALSE FALSE FALSE FALSE FALSE FALSE
[265] FALSE FALSE FALSE FALSE FALSE FALSE FALSE FALSE FALSE FALSE FALSE FALSE
[277] FALSE FALSE FALSE FALSE FALSE FALSE FALSE FALSE FALSE FALSE FALSE FALSE
[289] FALSE FALSE FALSE FALSE FALSE FALSE FALSE FALSE FALSE FALSE FALSE FALSE
[301] FALSE FALSE FALSE FALSE FALSE FALSE FALSE FALSE FALSE FALSE FALSE FALSE
[313] FALSE FALSE FALSE FALSE FALSE FALSE FALSE FALSE FALSE FALSE FALSE FALSE
[325] FALSE FALSE FALSE FALSE FALSE FALSE FALSE FALSE FALSE FALSE FALSE FALSE
[337] FALSE FALSE FALSE FALSE FALSE FALSE FALSE FALSEWe can subset the data using a boolen vector. We pass this boolean vector to the ROWS section of [,]
penguins[penguins$island == "Torgersen", ]# A tibble: 52 × 8
species island bill_length_mm bill_depth_mm flipper_length_mm body_mass_g
<fct> <fct> <dbl> <dbl> <int> <int>
1 Adelie Torgersen 39.1 18.7 181 3750
2 Adelie Torgersen 39.5 17.4 186 3800
3 Adelie Torgersen 40.3 18 195 3250
4 Adelie Torgersen NA NA NA NA
5 Adelie Torgersen 36.7 19.3 193 3450
6 Adelie Torgersen 39.3 20.6 190 3650
7 Adelie Torgersen 38.9 17.8 181 3625
8 Adelie Torgersen 39.2 19.6 195 4675
9 Adelie Torgersen 34.1 18.1 193 3475
10 Adelie Torgersen 42 20.2 190 4250
# ℹ 42 more rows
# ℹ 2 more variables: sex <fct>, year <int>penguins[penguins$island == "Torgersen", ]$body_mass_g [1] 3750 3800 3250 NA 3450 3650 3625 4675 3475 4250 3300 3700 3200 3800 4400
[16] 3700 3450 4500 3325 4200 3050 4450 3600 3900 3550 4150 3700 4250 3700 3900
[31] 3550 4000 3200 4700 3800 4200 2900 3775 3350 3325 3150 3500 3450 3875 3050
[46] 4000 3275 4300 3050 4000 3325 3500You can also use the following operators to supply multiple criteria: - & And operator. Both vector 1 and vector 2 must be true for the observation - | Or operator. Either vector 1 or vector 2 must be true for the observation
penguins$island == "Torgersen" & penguins$sex == "male" [1] TRUE FALSE FALSE NA FALSE TRUE FALSE TRUE NA NA NA NA
[13] FALSE TRUE TRUE FALSE FALSE TRUE FALSE TRUE FALSE FALSE FALSE FALSE
[25] FALSE FALSE FALSE FALSE FALSE FALSE FALSE FALSE FALSE FALSE FALSE FALSE
[37] FALSE FALSE FALSE FALSE FALSE FALSE FALSE FALSE FALSE FALSE FALSE FALSE
[49] FALSE FALSE FALSE FALSE FALSE FALSE FALSE FALSE FALSE FALSE FALSE FALSE
[61] FALSE FALSE FALSE FALSE FALSE FALSE FALSE FALSE FALSE TRUE FALSE TRUE
[73] FALSE TRUE FALSE TRUE FALSE TRUE FALSE TRUE FALSE TRUE FALSE TRUE
[85] FALSE FALSE FALSE FALSE FALSE FALSE FALSE FALSE FALSE FALSE FALSE FALSE
[97] FALSE FALSE FALSE FALSE FALSE FALSE FALSE FALSE FALSE FALSE FALSE FALSE
[109] FALSE FALSE FALSE FALSE FALSE FALSE FALSE FALSE FALSE TRUE FALSE TRUE
[121] FALSE TRUE FALSE TRUE FALSE TRUE FALSE TRUE FALSE TRUE FALSE TRUE
[133] FALSE FALSE FALSE FALSE FALSE FALSE FALSE FALSE FALSE FALSE FALSE FALSE
[145] FALSE FALSE FALSE FALSE FALSE FALSE FALSE FALSE FALSE FALSE FALSE FALSE
[157] FALSE FALSE FALSE FALSE FALSE FALSE FALSE FALSE FALSE FALSE FALSE FALSE
[169] FALSE FALSE FALSE FALSE FALSE FALSE FALSE FALSE FALSE FALSE FALSE FALSE
[181] FALSE FALSE FALSE FALSE FALSE FALSE FALSE FALSE FALSE FALSE FALSE FALSE
[193] FALSE FALSE FALSE FALSE FALSE FALSE FALSE FALSE FALSE FALSE FALSE FALSE
[205] FALSE FALSE FALSE FALSE FALSE FALSE FALSE FALSE FALSE FALSE FALSE FALSE
[217] FALSE FALSE FALSE FALSE FALSE FALSE FALSE FALSE FALSE FALSE FALSE FALSE
[229] FALSE FALSE FALSE FALSE FALSE FALSE FALSE FALSE FALSE FALSE FALSE FALSE
[241] FALSE FALSE FALSE FALSE FALSE FALSE FALSE FALSE FALSE FALSE FALSE FALSE
[253] FALSE FALSE FALSE FALSE FALSE FALSE FALSE FALSE FALSE FALSE FALSE FALSE
[265] FALSE FALSE FALSE FALSE FALSE FALSE FALSE FALSE FALSE FALSE FALSE FALSE
[277] FALSE FALSE FALSE FALSE FALSE FALSE FALSE FALSE FALSE FALSE FALSE FALSE
[289] FALSE FALSE FALSE FALSE FALSE FALSE FALSE FALSE FALSE FALSE FALSE FALSE
[301] FALSE FALSE FALSE FALSE FALSE FALSE FALSE FALSE FALSE FALSE FALSE FALSE
[313] FALSE FALSE FALSE FALSE FALSE FALSE FALSE FALSE FALSE FALSE FALSE FALSE
[325] FALSE FALSE FALSE FALSE FALSE FALSE FALSE FALSE FALSE FALSE FALSE FALSE
[337] FALSE FALSE FALSE FALSE FALSE FALSE FALSE FALSEpenguins$island == "Torgersen" | penguins$sex == "male" [1] TRUE TRUE TRUE TRUE TRUE TRUE TRUE TRUE TRUE TRUE TRUE TRUE
[13] TRUE TRUE TRUE TRUE TRUE TRUE TRUE TRUE FALSE TRUE FALSE TRUE
[25] TRUE FALSE TRUE FALSE FALSE TRUE FALSE TRUE FALSE TRUE FALSE TRUE
[37] TRUE FALSE FALSE TRUE FALSE TRUE FALSE TRUE FALSE TRUE TRUE NA
[49] FALSE TRUE FALSE TRUE FALSE TRUE FALSE TRUE FALSE TRUE FALSE TRUE
[61] FALSE TRUE FALSE TRUE FALSE TRUE FALSE TRUE TRUE TRUE TRUE TRUE
[73] TRUE TRUE TRUE TRUE TRUE TRUE TRUE TRUE TRUE TRUE TRUE TRUE
[85] FALSE TRUE TRUE FALSE TRUE FALSE FALSE TRUE FALSE TRUE FALSE TRUE
[97] FALSE TRUE FALSE TRUE FALSE TRUE FALSE TRUE FALSE TRUE FALSE TRUE
[109] FALSE TRUE FALSE TRUE FALSE TRUE FALSE TRUE TRUE TRUE TRUE TRUE
[121] TRUE TRUE TRUE TRUE TRUE TRUE TRUE TRUE TRUE TRUE TRUE TRUE
[133] FALSE TRUE FALSE TRUE FALSE TRUE FALSE TRUE FALSE TRUE FALSE TRUE
[145] FALSE TRUE TRUE FALSE FALSE TRUE FALSE TRUE FALSE TRUE FALSE TRUE
[157] TRUE FALSE FALSE TRUE FALSE TRUE FALSE TRUE FALSE TRUE FALSE TRUE
[169] FALSE TRUE FALSE TRUE TRUE FALSE FALSE TRUE FALSE TRUE NA TRUE
[181] FALSE TRUE TRUE FALSE FALSE TRUE FALSE TRUE FALSE TRUE FALSE TRUE
[193] FALSE TRUE FALSE TRUE TRUE FALSE FALSE TRUE FALSE TRUE FALSE TRUE
[205] FALSE TRUE FALSE TRUE FALSE TRUE FALSE TRUE FALSE TRUE FALSE TRUE
[217] FALSE TRUE NA TRUE FALSE TRUE FALSE TRUE TRUE FALSE FALSE TRUE
[229] FALSE TRUE FALSE TRUE FALSE TRUE FALSE TRUE FALSE TRUE FALSE TRUE
[241] FALSE TRUE FALSE TRUE FALSE TRUE FALSE TRUE TRUE FALSE FALSE TRUE
[253] FALSE TRUE FALSE TRUE NA TRUE FALSE TRUE FALSE TRUE FALSE TRUE
[265] FALSE TRUE FALSE TRUE NA TRUE FALSE NA FALSE TRUE FALSE TRUE
[277] FALSE TRUE TRUE FALSE TRUE FALSE FALSE TRUE FALSE TRUE FALSE TRUE
[289] FALSE TRUE FALSE TRUE TRUE FALSE FALSE TRUE FALSE TRUE FALSE TRUE
[301] FALSE TRUE FALSE TRUE FALSE TRUE FALSE TRUE FALSE TRUE TRUE FALSE
[313] FALSE TRUE FALSE TRUE TRUE FALSE TRUE FALSE FALSE TRUE FALSE TRUE
[325] TRUE FALSE FALSE TRUE FALSE TRUE FALSE TRUE FALSE TRUE TRUE FALSE
[337] TRUE FALSE FALSE TRUE FALSE TRUE TRUE FALSE4.3.0.1 Exercise
- Subset the
penguinsdataframe to male penguins that weigh over 3500 grams
- Are all three species present on the Torgersen island? The
tableoruniquefunctions might be helpful here.
- Which species has the heaviest penguin?
4.3.0.2 Exercise
Lets compare Bill Length between the three species of penguins in our dataset: the Adelie, Gentoo, and Chinstrap penguins.
Using [] and <-, create 3 dataframes called penguins_ad, penguins_gent, and penguins_chin that subset based on the correct species of penguins.
“Adelie”, “Gentoo”, “Chinstrap”
What is the mean of each species bill length in millimeters? (remember there are NAs so we will need to use na.rm = TRUE).
4.4 Creating new variables
We can create new variables in our dataset by using the $ or [] operators with <-.
penguins$body_mass_g [1] 3750 3800 3250 NA 3450 3650 3625 4675 3475 4250 3300 3700 3200 3800 4400
[16] 3700 3450 4500 3325 4200 3400 3600 3800 3950 3800 3800 3550 3200 3150 3950
[31] 3250 3900 3300 3900 3325 4150 3950 3550 3300 4650 3150 3900 3100 4400 3000
[46] 4600 3425 2975 3450 4150 3500 4300 3450 4050 2900 3700 3550 3800 2850 3750
[61] 3150 4400 3600 4050 2850 3950 3350 4100 3050 4450 3600 3900 3550 4150 3700
[76] 4250 3700 3900 3550 4000 3200 4700 3800 4200 3350 3550 3800 3500 3950 3600
[91] 3550 4300 3400 4450 3300 4300 3700 4350 2900 4100 3725 4725 3075 4250 2925
[106] 3550 3750 3900 3175 4775 3825 4600 3200 4275 3900 4075 2900 3775 3350 3325
[121] 3150 3500 3450 3875 3050 4000 3275 4300 3050 4000 3325 3500 3500 4475 3425
[136] 3900 3175 3975 3400 4250 3400 3475 3050 3725 3000 3650 4250 3475 3450 3750
[151] 3700 4000 4500 5700 4450 5700 5400 4550 4800 5200 4400 5150 4650 5550 4650
[166] 5850 4200 5850 4150 6300 4800 5350 5700 5000 4400 5050 5000 5100 4100 5650
[181] 4600 5550 5250 4700 5050 6050 5150 5400 4950 5250 4350 5350 3950 5700 4300
[196] 4750 5550 4900 4200 5400 5100 5300 4850 5300 4400 5000 4900 5050 4300 5000
[211] 4450 5550 4200 5300 4400 5650 4700 5700 4650 5800 4700 5550 4750 5000 5100
[226] 5200 4700 5800 4600 6000 4750 5950 4625 5450 4725 5350 4750 5600 4600 5300
[241] 4875 5550 4950 5400 4750 5650 4850 5200 4925 4875 4625 5250 4850 5600 4975
[256] 5500 4725 5500 4700 5500 4575 5500 5000 5950 4650 5500 4375 5850 4875 6000
[271] 4925 NA 4850 5750 5200 5400 3500 3900 3650 3525 3725 3950 3250 3750 4150
[286] 3700 3800 3775 3700 4050 3575 4050 3300 3700 3450 4400 3600 3400 2900 3800
[301] 3300 4150 3400 3800 3700 4550 3200 4300 3350 4100 3600 3900 3850 4800 2700
[316] 4500 3950 3650 3550 3500 3675 4450 3400 4300 3250 3675 3325 3950 3600 4050
[331] 3350 3450 3250 4050 3800 3525 3950 3650 3650 4000 3400 3775 4100 3775# 0.0022 lbs = 1 g
penguins$body_mass_lb <- 0.00220462 * penguins$body_mass_g4.4.1 Exericse
Your R exercise asks you to calculate the standard deviation without using the var() or sd() command. We want to remove NAs manually to fix this. A helpful command is is.na(). Let’s practice computing the variance of body_mass_lb by hand. You will want to use nrow()
4.5 Loading data into R
In R, you can either load data from a website or from a computer. Usually data is found in a .csv file, but sometimes it will be in different forms that R can read.
# From a website
fandango <- read.csv("https://raw.githubusercontent.com/kylebutts/UARK_4753/refs/heads/main/R_Labs/Lab_02/data/fandango_score_comparison.csv")
head(fandango)
FILM RottenTomatoes RottenTomatoes_User Metacritic
1 Avengers: Age of Ultron (2015) 74 86 66
2 Cinderella (2015) 85 80 67
3 Ant-Man (2015) 80 90 64
4 Do You Believe? (2015) 18 84 22
5 Hot Tub Time Machine 2 (2015) 14 28 29
6 The Water Diviner (2015) 63 62 50
Metacritic_User IMDB Fandango_Stars Fandango_Ratingvalue RT_norm RT_user_norm
1 7.1 7.8 5.0 4.5 3.70 4.3
2 7.5 7.1 5.0 4.5 4.25 4.0
3 8.1 7.8 5.0 4.5 4.00 4.5
4 4.7 5.4 5.0 4.5 0.90 4.2
5 3.4 5.1 3.5 3.0 0.70 1.4
6 6.8 7.2 4.5 4.0 3.15 3.1
Metacritic_norm Metacritic_user_nom IMDB_norm RT_norm_round
1 3.30 3.55 3.90 3.5
2 3.35 3.75 3.55 4.5
3 3.20 4.05 3.90 4.0
4 1.10 2.35 2.70 1.0
5 1.45 1.70 2.55 0.5
6 2.50 3.40 3.60 3.0
RT_user_norm_round Metacritic_norm_round Metacritic_user_norm_round
1 4.5 3.5 3.5
2 4.0 3.5 4.0
3 4.5 3.0 4.0
4 4.0 1.0 2.5
5 1.5 1.5 1.5
6 3.0 2.5 3.5
IMDB_norm_round Metacritic_user_vote_count IMDB_user_vote_count
1 4.0 1330 271107
2 3.5 249 65709
3 4.0 627 103660
4 2.5 31 3136
5 2.5 88 19560
6 3.5 34 39373
Fandango_votes Fandango_Difference
1 14846 0.5
2 12640 0.5
3 12055 0.5
4 1793 0.5
5 1021 0.5
6 397 0.5However, most common is to download the data and put it in the folder where your .Rmd file is. To load data you will need to find the file location. By default, the working directory is whereever the .qmd file is located. So if your dataset is in the same folder as .qmd, you can load it by name:
penguins <- read.csv("data/penguins.csv")Or, say you have your data in a subfolder called data. Then, you would use penguins <- read.csv("data/penguins.csv").
If you have a dataframe that you want to export to a csv function, you will use the function write.csv(df, "path/to/file.csv"). This uses the same working directory as read.csv and relative paths to the file work the same way.
4.6 Sorting dataframes
There are two different ways to sort the rows of a data.frame.
First, we can use the order method we used on vectors: df[order(...), ].
penguins[order(penguins$body_mass_g), ]# A tibble: 344 × 9
species island bill_length_mm bill_depth_mm flipper_length_mm body_mass_g
<fct> <fct> <dbl> <dbl> <int> <int>
1 Chinstrap Dream 46.9 16.6 192 2700
2 Adelie Biscoe 36.5 16.6 181 2850
3 Adelie Biscoe 36.4 17.1 184 2850
4 Adelie Biscoe 34.5 18.1 187 2900
5 Adelie Dream 33.1 16.1 178 2900
6 Adelie Torgers… 38.6 17 188 2900
7 Chinstrap Dream 43.2 16.6 187 2900
8 Adelie Biscoe 37.9 18.6 193 2925
9 Adelie Dream 37.5 18.9 179 2975
10 Adelie Dream 37 16.9 185 3000
# ℹ 334 more rows
# ℹ 3 more variables: sex <fct>, year <int>, body_mass_lb <dbl>Or, we can use special function sort_by. This takes two arguments: 1. the data.frame and 2. the vector you want to sort by:
sort_by(penguins, penguins$body_mass_g)# A tibble: 344 × 9
species island bill_length_mm bill_depth_mm flipper_length_mm body_mass_g
<fct> <fct> <dbl> <dbl> <int> <int>
1 Chinstrap Dream 46.9 16.6 192 2700
2 Adelie Biscoe 36.5 16.6 181 2850
3 Adelie Biscoe 36.4 17.1 184 2850
4 Adelie Biscoe 34.5 18.1 187 2900
5 Adelie Dream 33.1 16.1 178 2900
6 Adelie Torgers… 38.6 17 188 2900
7 Chinstrap Dream 43.2 16.6 187 2900
8 Adelie Biscoe 37.9 18.6 193 2925
9 Adelie Dream 37.5 18.9 179 2975
10 Adelie Dream 37 16.9 185 3000
# ℹ 334 more rows
# ℹ 3 more variables: sex <fct>, year <int>, body_mass_lb <dbl>Alternatively, we can pass a one-sided formula that gives the variables you want to sort by. A formula is a commonly used tool in R that lets you write variable name(s) without needing to specify the data.frame they come from.
A one-sided formula is written as ~ xvar (the tilde is next to the number 1 on your keyboard).
sort_by(penguins, ~body_mass_g)# A tibble: 344 × 9
species island bill_length_mm bill_depth_mm flipper_length_mm body_mass_g
<fct> <fct> <dbl> <dbl> <int> <int>
1 Chinstrap Dream 46.9 16.6 192 2700
2 Adelie Biscoe 36.5 16.6 181 2850
3 Adelie Biscoe 36.4 17.1 184 2850
4 Adelie Biscoe 34.5 18.1 187 2900
5 Adelie Dream 33.1 16.1 178 2900
6 Adelie Torgers… 38.6 17 188 2900
7 Chinstrap Dream 43.2 16.6 187 2900
8 Adelie Biscoe 37.9 18.6 193 2925
9 Adelie Dream 37.5 18.9 179 2975
10 Adelie Dream 37 16.9 185 3000
# ℹ 334 more rows
# ℹ 3 more variables: sex <fct>, year <int>, body_mass_lb <dbl>Say we want to first sort by species (so that each species is a contiguous chunk of rows) and then within species, sort by body mass. To do so, we can use multiple variables separated by a + in the formula syntax.
sort_by(penguins, ~species + body_mass_g)# A tibble: 344 × 9
species island bill_length_mm bill_depth_mm flipper_length_mm body_mass_g
<fct> <fct> <dbl> <dbl> <int> <int>
1 Adelie Biscoe 36.5 16.6 181 2850
2 Adelie Biscoe 36.4 17.1 184 2850
3 Adelie Biscoe 34.5 18.1 187 2900
4 Adelie Dream 33.1 16.1 178 2900
5 Adelie Torgersen 38.6 17 188 2900
6 Adelie Biscoe 37.9 18.6 193 2925
7 Adelie Dream 37.5 18.9 179 2975
8 Adelie Dream 37 16.9 185 3000
9 Adelie Dream 37.3 16.8 192 3000
10 Adelie Torgersen 35.9 16.6 190 3050
# ℹ 334 more rows
# ℹ 3 more variables: sex <fct>, year <int>, body_mass_lb <dbl>4.6.0.1 Exercise
Load
fandango_score_comparison.csvCompute the five-number summary for Rotten Tomatoes, Metacritic, and IMDB scores.
Subset data for Rotten Tomatoes User scores above 90
Let’s see if there are any movies that are “universally acclaimed”. Create a logical vector for any movie with an IMDB score above 8.5 and a Rotten Tomatoes User scores above 85.
Among those movies with a Rotten Tomatoes User score above 90, what is the five-number summary of IMDB Scores